Thomas Bulkowski: Chart Patterns and The Evolution of a Trader
Trader's Library #44 · Technical analysis. Pattern analysis with statistics instead of promises.
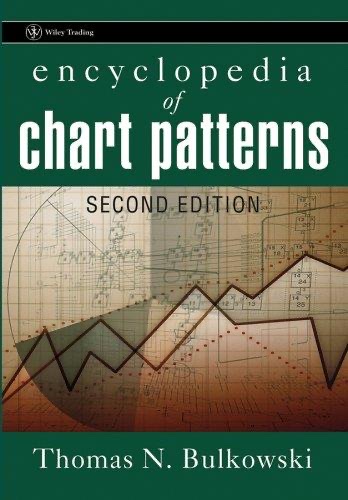
Author: Thomas N. Bulkowski · Original: incl. Trading Basics; Fundamental Analysis and Position Trading; Swing and Day Trading · Year: 2012 · Usefulness for traders: ★★★★☆
What it's about
Bulkowski, author of the famous encyclopedia of chart patterns, studies patterns across thousands of examples and gives the statistics: how often they work and how big a move they produce. I cover his introduction to chart pattern analysis and the three volumes of “The Evolution of a Trader”: “Trading Basics”, “Fundamental Analysis and Position Trading” and “Swing and Day Trading”.
What it gives a trader
Bulkowski does what most technical analysis textbooks fail to do: he measures. He teaches scepticism towards patterns and shows that even the “best” ones fail a significant share of the time. The last volume covers shorter horizons.
Lessons for traders
- patterns are statistics, not certainty
- a pattern's outcome depends on the market context and the trend
- measure your own setups instead of believing the textbooks (the illusion of validity, Atlas of biases #20)
What to watch out for
The statistics come mainly from US stocks on daily charts. On intraday futures they may look different.
Discussion
The discussion takes place in Hetman Capital Club (in Polish). Join the discussion in the Club →
Navigation
← #043 Trading Price Action: Trends and Reversals (Al Brooks) · Library index · #045 Technical Analysis Explained (Martin J. Pring) →
Educational content, not investment advice. The book description is my own summary and assessment, not quotations. Edition details were checked in catalogues and bookshops, and where there was doubt I said so plainly.