♛ Hetman Terminal: order flow tools in your browser
These are real screenshots from the Hetman Terminal in Club, taken on the Hetman Index (IHA) – a training instrument with simulated data. Liquidity heatmap, DOM, footprint, Volume Profile, TPO, cumulative delta and the trade tape are the same kind of tools you know from professional order flow platforms such as Sierra Chart, ATAS or Bookmap. The difference: here they run live in your browser – no software to install and no platform of your own. The Terminal and Club are in Polish.
💻 The Hetman Terminal is also a desktop app for Windows and Mac
The desktop app shows the Terminal’s order flow tools on data from your own account with a data provider: today Interactive Brokers, soon dxFeed and Rithmic. You buy exchange data on your own, and it flows straight to your computer, not through our servers. The app only analyses – it does not place orders – and it updates itself. For Club members from the ♝ Bishop plan up (the app and Club are in Polish).
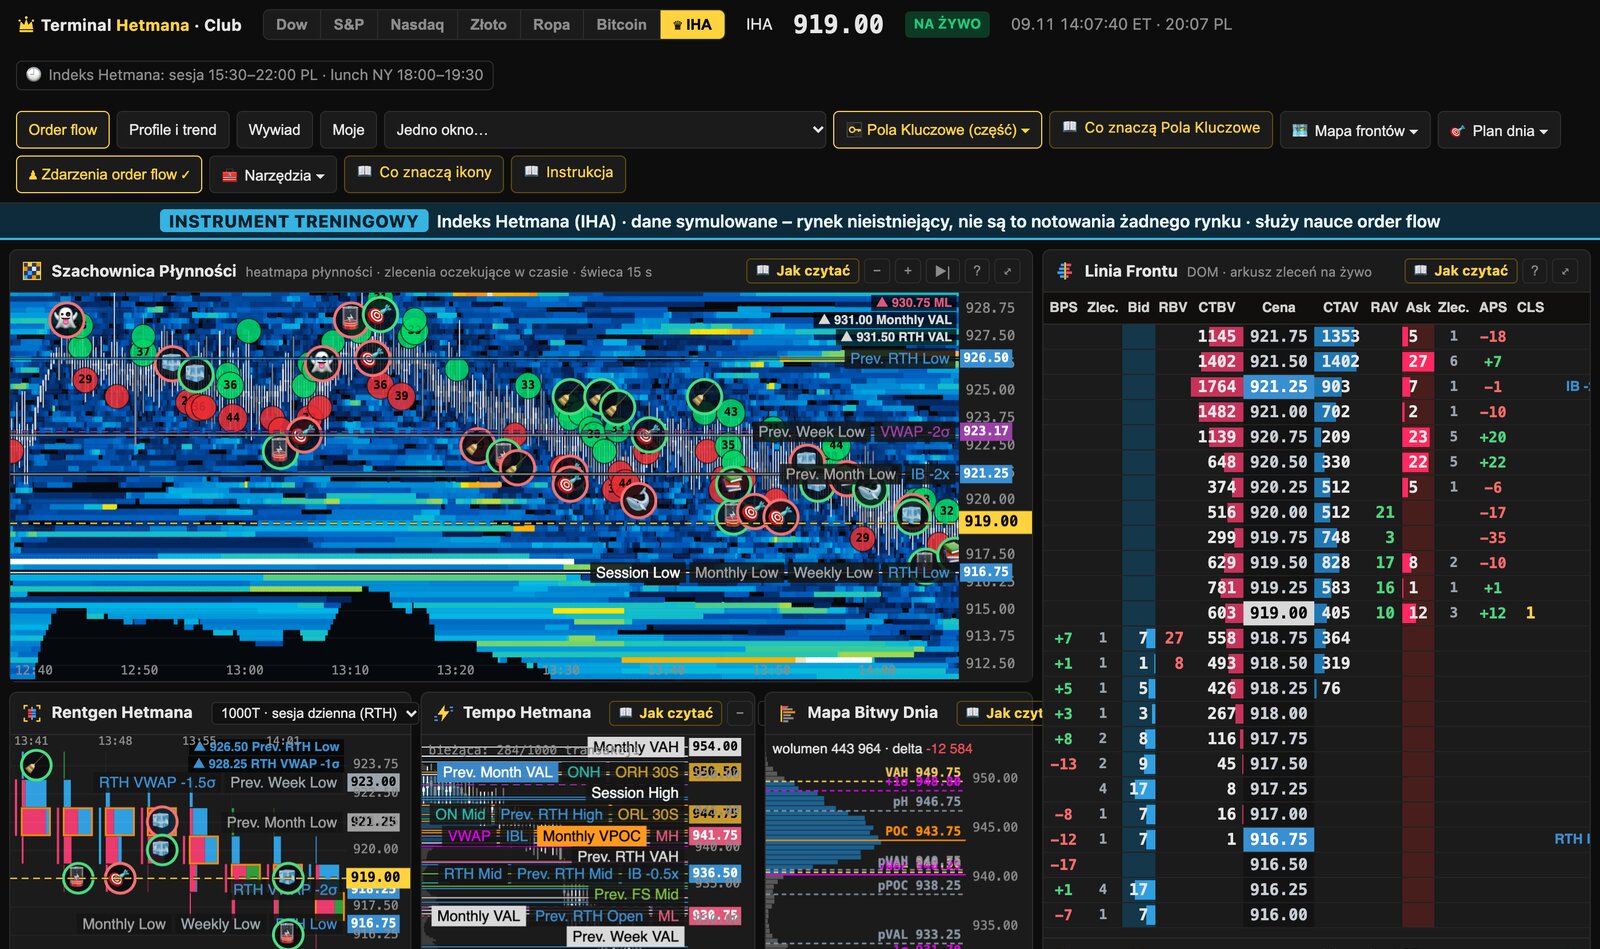
💡 The same order flow tools you pay for in popular platforms
In Bookmap, ATAS, Sierra Chart, NinjaTrader, Quantower, MotiveWave, Jigsaw or TradingView, the heatmap, footprint, DOM, Volume Profile and TPO usually come as paid versions, add-ons or bundles, plus separately paid exchange data. In the Hetman Terminal they are ready, set up and explained (in Polish).
The tools at a glance
| In the Terminal | Technical name | Same kind of tool in |
|---|---|---|
| Liquidity Chessboard | liquidity heatmap | Bookmap, ATAS, Quantower, Sierra Chart |
| Front Line | DOM · live order book | Sierra Chart, ATAS, Bookmap, NinjaTrader, Jigsaw, Quantower |
| Hetman X-Ray | footprint | ATAS, Sierra Chart, NinjaTrader (Order Flow+), Quantower, MotiveWave, TradingView |
| Hetman Tempo | tick chart | Sierra Chart, ATAS, NinjaTrader, Quantower, MotiveWave, TradingView |
| Battle Map of the Day | session volume profile · VWAP ±σ | Sierra Chart, ATAS, NinjaTrader, Quantower, MotiveWave, TradingView |
| Chess Clock | TPO · Market Profile | Sierra Chart, ATAS, Quantower, MotiveWave, TradingView |
| Volume Bastions | Volume Profile: day, week, month | Sierra Chart, ATAS, NinjaTrader, Quantower, MotiveWave, TradingView |
| Trend Formation | Renko · NYSE TICK / ADD | Sierra Chart, NinjaTrader, TradingView |
| X-Ray 30 | 30-min footprint | ATAS, Sierra Chart, NinjaTrader (Order Flow+), Quantower, MotiveWave, TradingView |
| Bastions 30 | 30-min Volume Profile | Sierra Chart, ATAS, NinjaTrader, Quantower, MotiveWave, TradingView |
| Balance of Forces | cumulative delta (CVD) | ATAS, Sierra Chart, Bookmap, NinjaTrader, Quantower, TradingView |
| Field Reports | trade tape · Time & Sales | Sierra Chart, ATAS, Bookmap, NinjaTrader, Jigsaw, Quantower |
| Terminal Report | opening and day type · Market Profile | in other platforms you describe the session yourself |
Order flow – what is happening in the order book
Liquidity Chessboard · liquidity heatmap
Resting orders in the book over time: the brighter the colour, the more contracts waiting at that level. You see where large orders sit, when they get pulled right before price arrives, and where price bounces off them or eats through them. The chart also shows the Key Squares (VWAP, previous-session levels, IB, overnight).
💡 In other software: liquidity heatmap as in Bookmap, ATAS, Quantower, Sierra Chart.

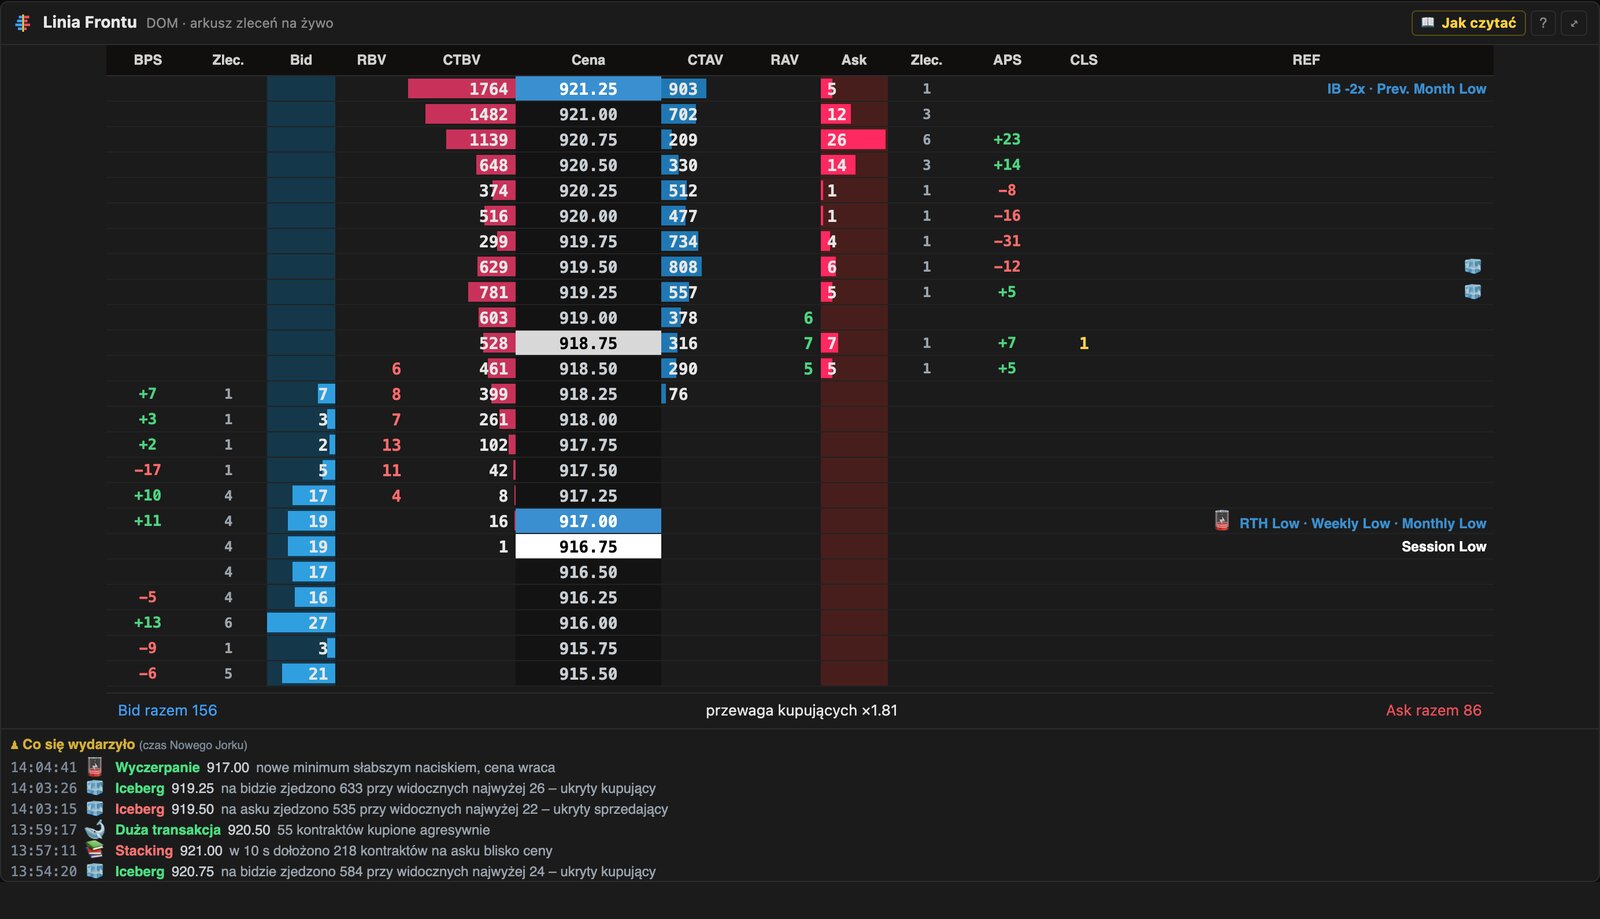
Front Line · DOM · live order book
The order book price by price: how many contracts are waiting on the bid and the ask, how much traded at each price this session, changes in the book and whether buyers or sellers dominate near price.
💡 In other software: DOM as in Sierra Chart, ATAS, Bookmap, NinjaTrader, Jigsaw, Quantower.
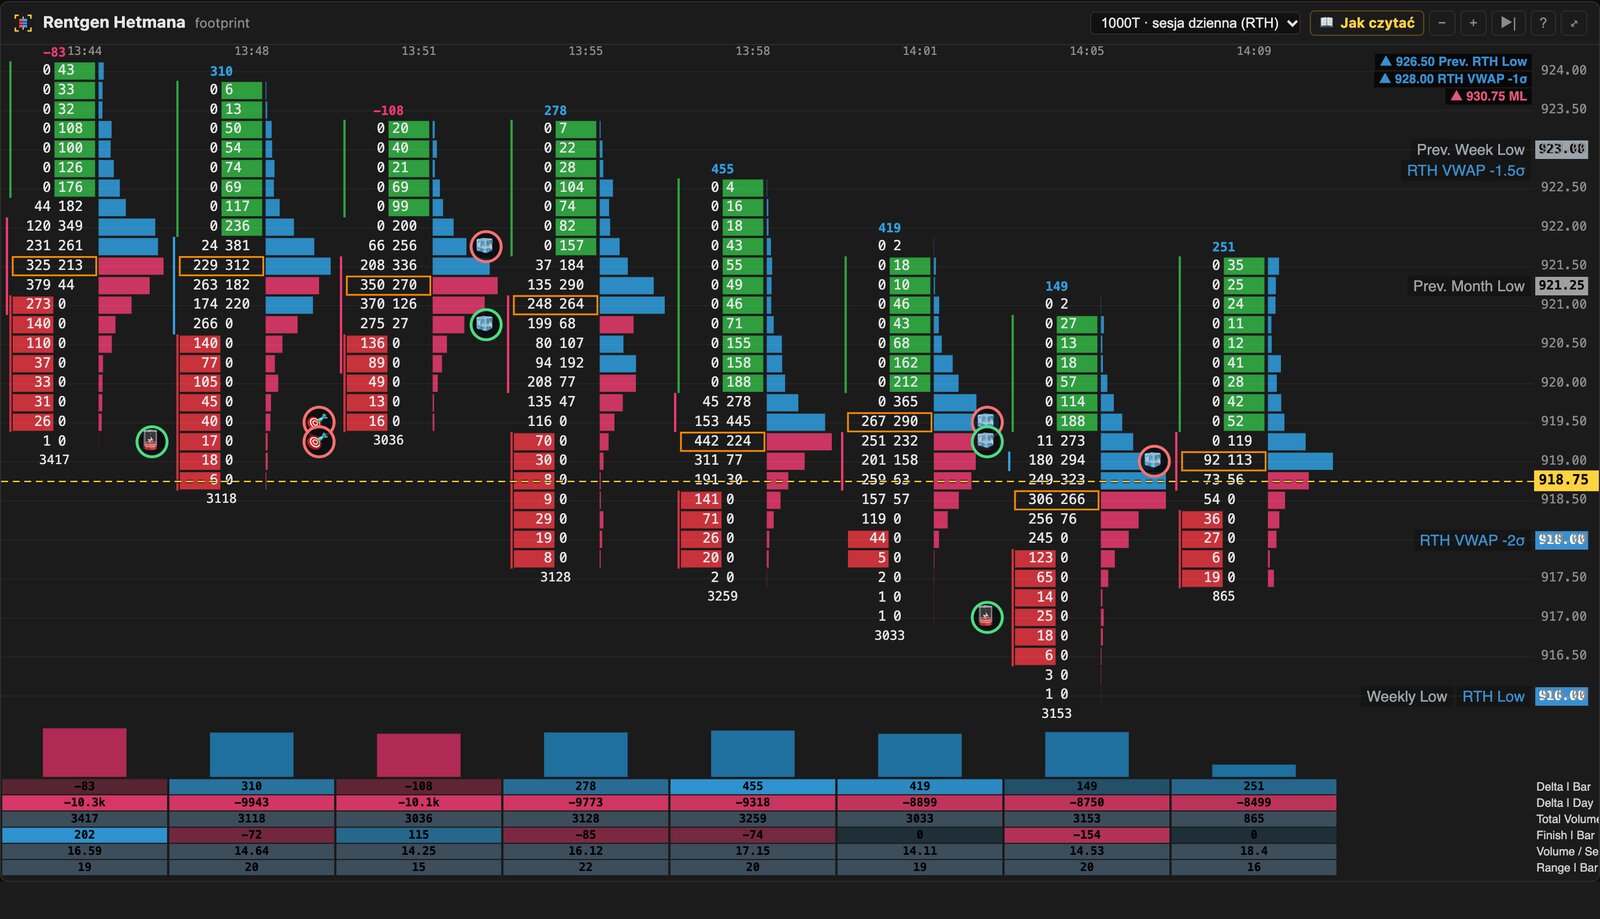
Hetman X-Ray · footprint
Inside every bar: at each price, how much was sold at the bid and bought at the ask. Imbalances (one side dominating), the bar's POC boxed, delta above the bar. Choose the interval from 500 trades to 60 minutes.
💡 In other software: footprint as in ATAS, Sierra Chart, NinjaTrader (Order Flow+), Quantower, MotiveWave, TradingView.
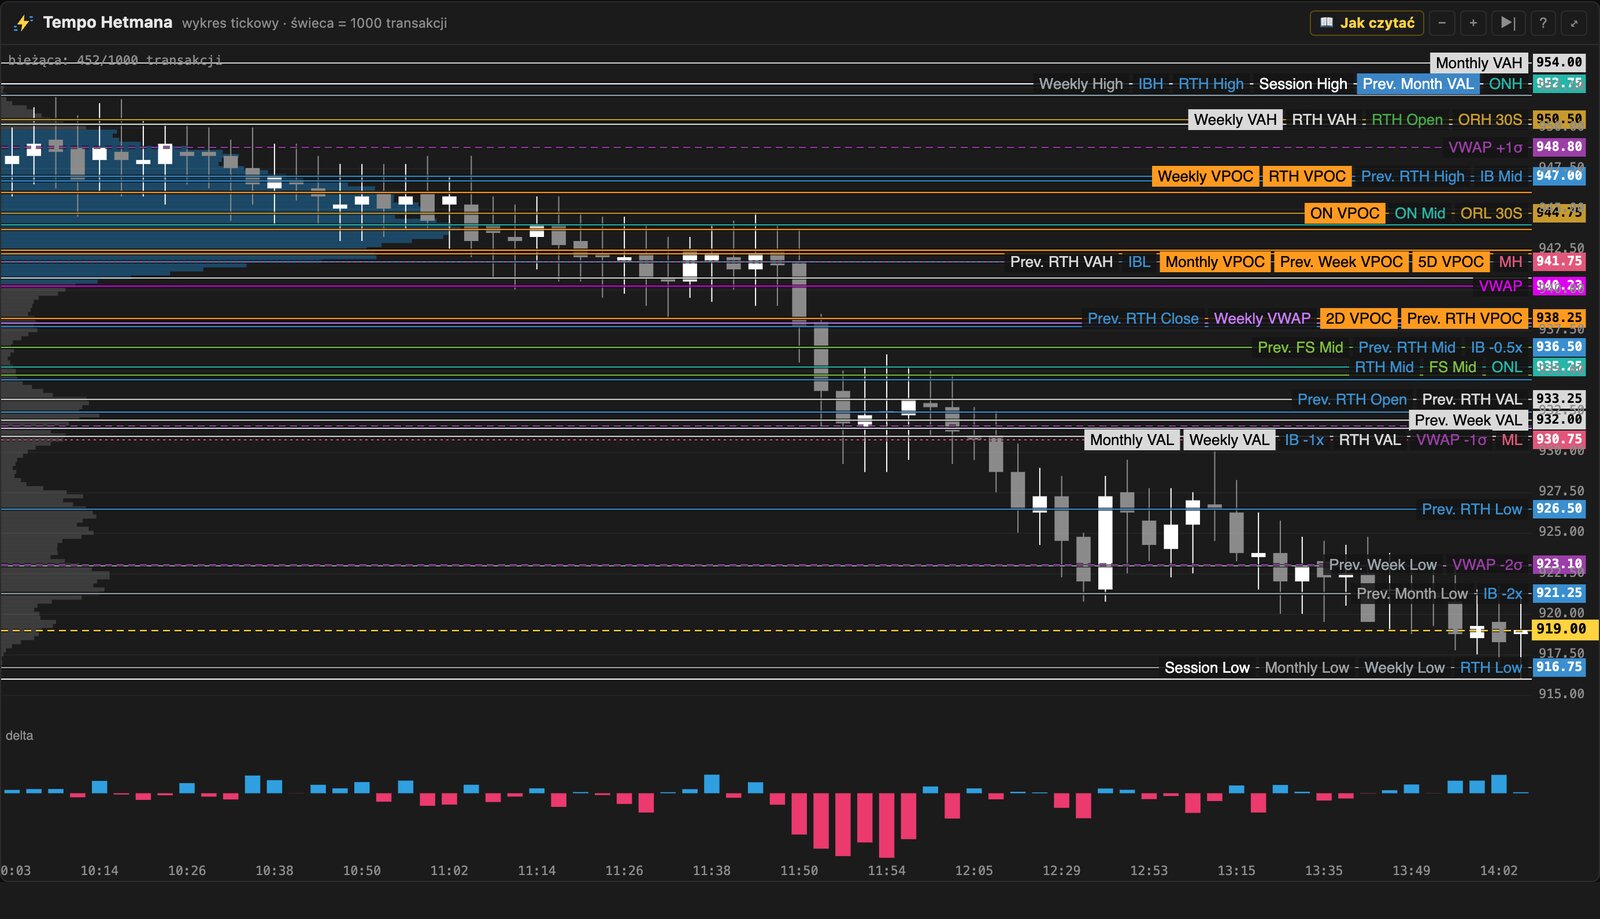
Hetman Tempo · tick chart
Bars built from trade count, not time – they print faster when the market is busy. Plus a volume profile and the Key Squares.
💡 In other software: a tick chart with a volume profile as in Sierra Chart, ATAS, NinjaTrader, Quantower, MotiveWave, TradingView.
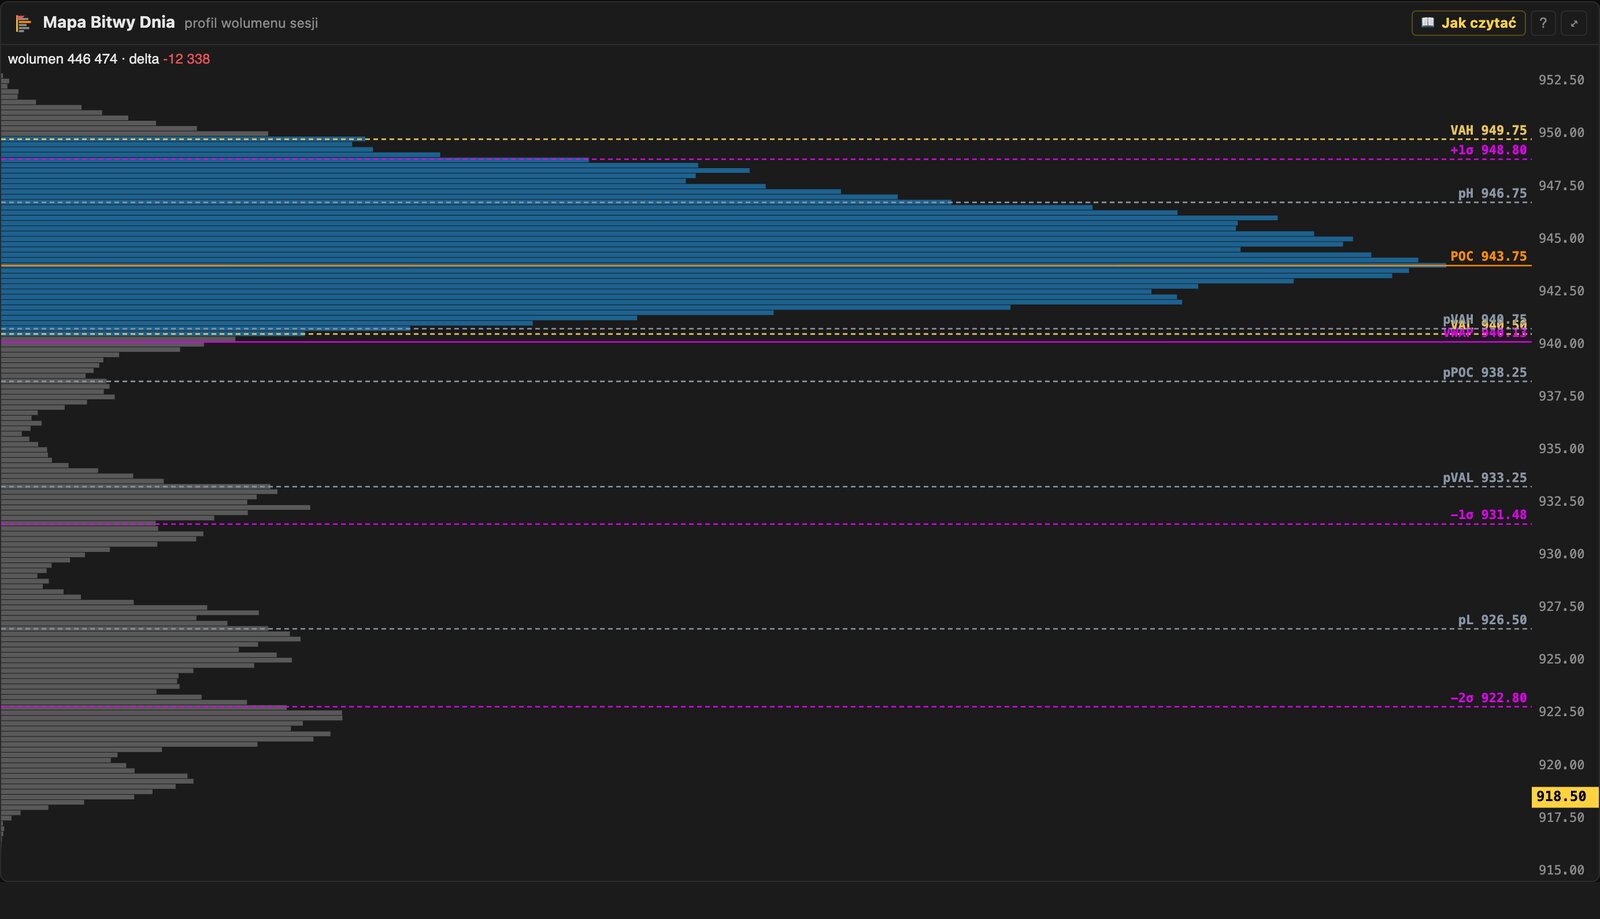
Battle Map of the Day · session volume profile · VWAP ±σ
The current session's volume profile: POC, Value Area (VAH/VAL), VWAP with deviation bands and previous-session levels. You see at a glance where the market accepts price as “fair” and where it rejects it.
💡 In other software: session volume profile with VWAP as in Sierra Chart, ATAS, NinjaTrader, Quantower, MotiveWave, TradingView.
Profiles and trend – the bigger picture
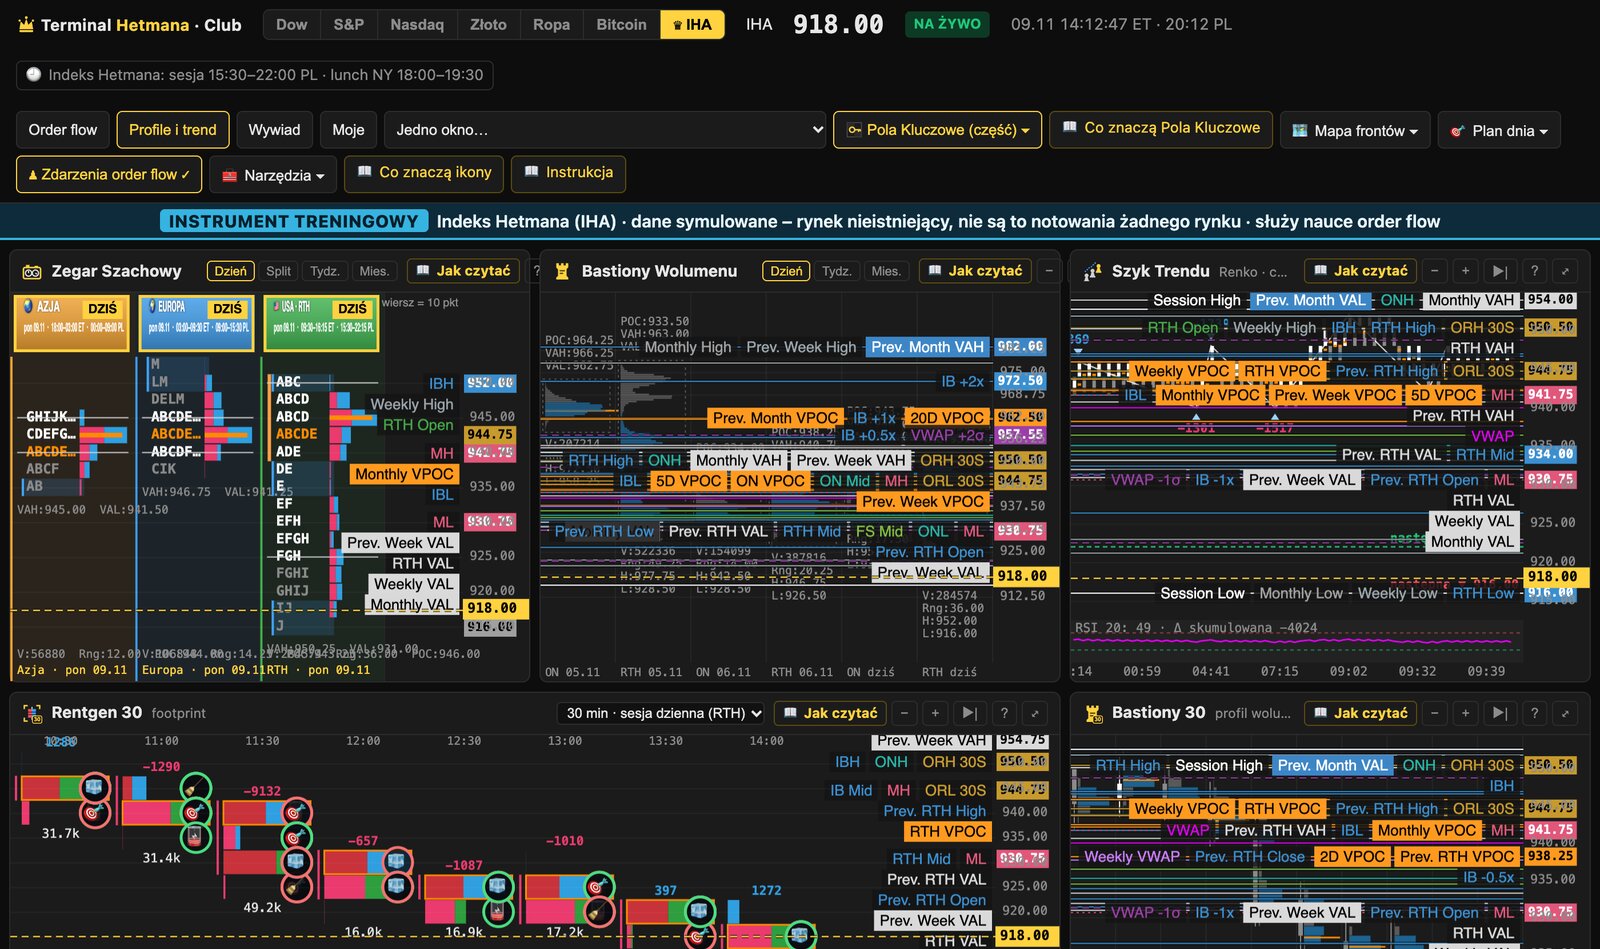
Chess Clock · TPO · Market Profile
Market Profile with letters: each letter is time price spent at that level. Initial Balance, single prints, a split into Asia, Europe and the US session, plus weekly and monthly views.
💡 In other software: TPO as in Sierra Chart, ATAS, Quantower, MotiveWave, TradingView.

Volume Bastions · Volume Profile: day, week, month
Volume profiles of each day, week and month side by side: where the heaviest trading has been in recent sessions, and whether value is moving up, down or staying put.
💡 In other software: daily, weekly and monthly Volume Profile as in Sierra Chart, ATAS, NinjaTrader, Quantower, MotiveWave, TradingView.

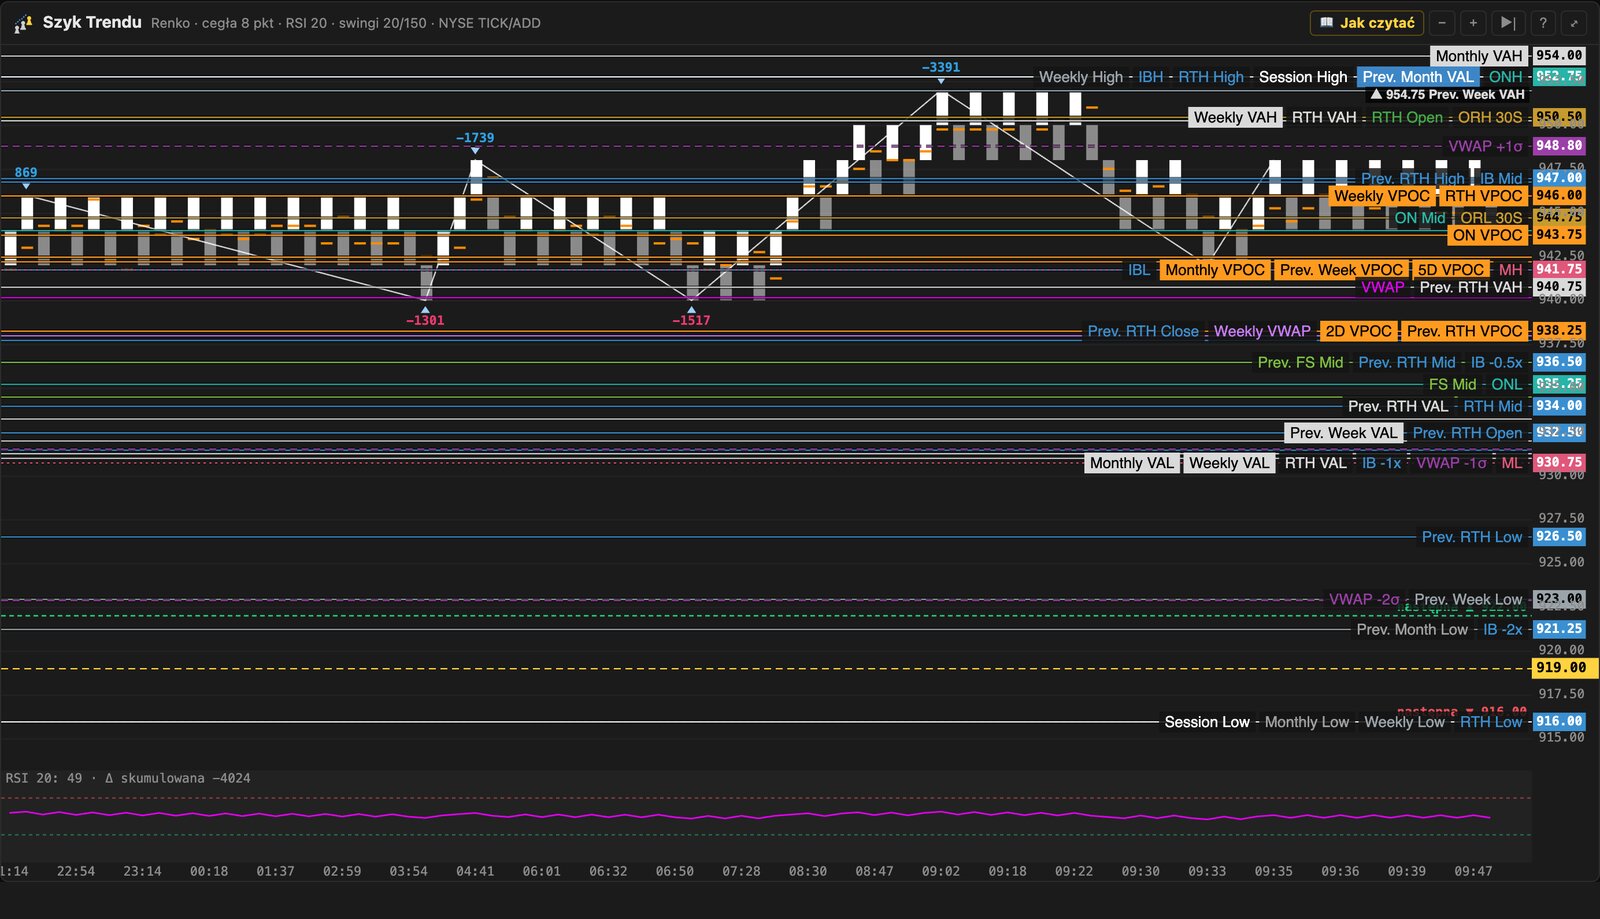
Trend Formation · Renko · NYSE TICK / ADD
A Renko chart: a new brick only after price moves a set number of points – time doesn't matter, only direction remains. Below it, NYSE stock-market breadth (TICK and ADD) and cumulative delta at the swings.
💡 In other software: Renko as in Sierra Chart, NinjaTrader, TradingView.
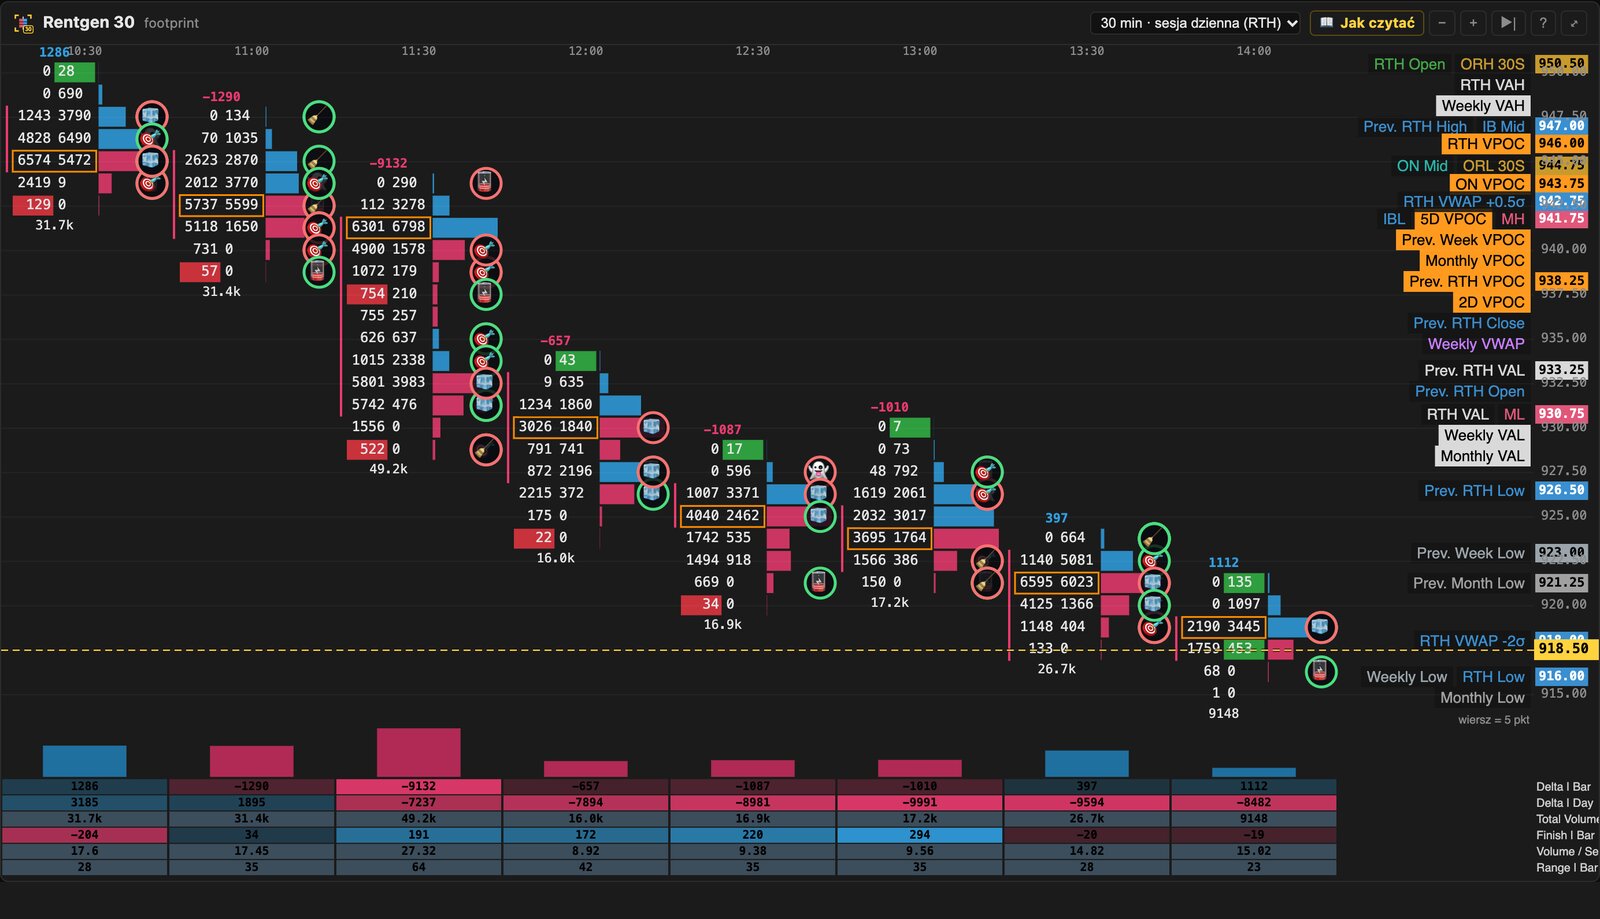
X-Ray 30 · 30-min footprint
Footprint on a bigger scale: each column is 30 minutes, showing where aggressive buying and selling happened during the day and where the heaviest trading was.
💡 In other software: 30-min footprint as in ATAS, Sierra Chart, NinjaTrader (Order Flow+), Quantower, MotiveWave, TradingView.
Bastions 30 · 30-min Volume Profile
Every half hour with its own volume profile and POC. When successive POCs climb, buyers are moving value higher (and vice versa).
💡 In other software: 30-min Volume Profile as in Sierra Chart, ATAS, NinjaTrader, Quantower, MotiveWave, TradingView.

Intelligence – strength of each side, the tape and a session report
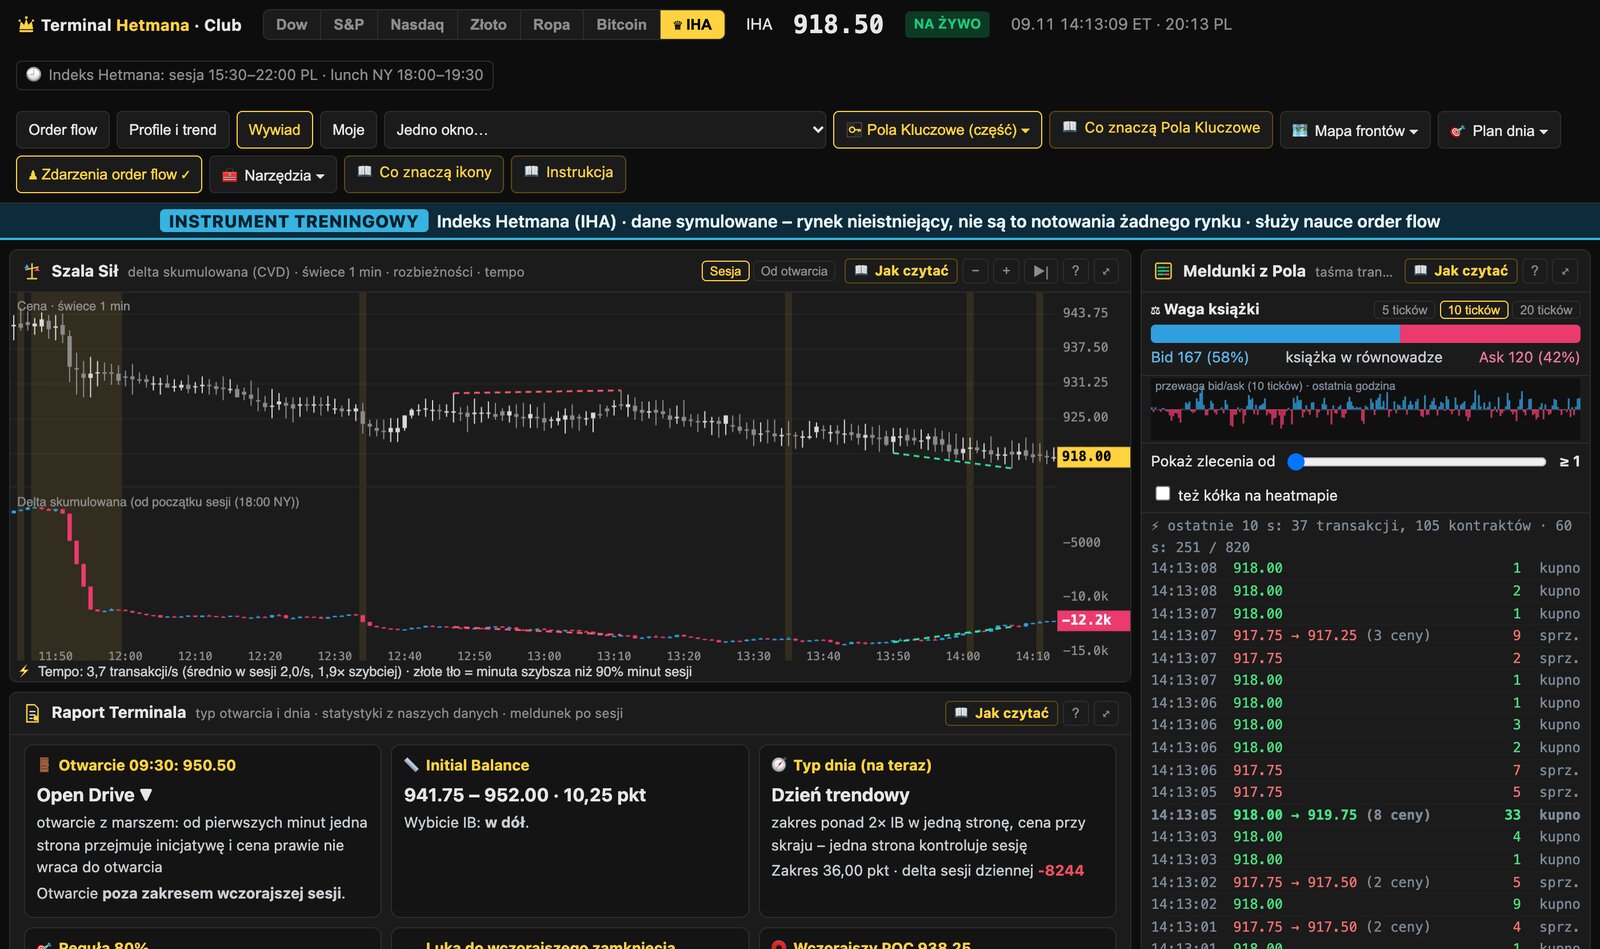
Balance of Forces · cumulative delta (CVD)
Buying at the ask minus selling at the bid, summed from the start of the session or from the open, under the price chart. Divergences (price up, delta down) and trade pace.
💡 In other software: cumulative delta (CVD) as in ATAS, Sierra Chart, Bookmap, NinjaTrader, Quantower, TradingView.

Field Reports · trade tape · Time & Sales
Every trade live: time, price, number of contracts and side (buy at the ask, sell at the bid), with a size filter. Above the tape, the “book scale” – the order imbalance near price.
💡 In other software: trade tape as in Sierra Chart, ATAS, Bookmap, NinjaTrader, Jigsaw, Quantower.

Terminal Report · opening and day type · Market Profile
A live description of the session in Market Profile terms: opening type, location versus yesterday's value, Initial Balance width compared with previous sessions, day type and historical statistics.
💡 In other software: you usually judge the Market Profile opening type and day type yourself from the profile – here it is described for you live.

What else is in the Terminal
- Key Squares – levels ready on the charts: VWAP with bands, previous session (High/Low/Close, VPOC, VAH/VAL), Initial Balance, overnight, week, month, naked VPOCs. In other platforms you set these up yourself with studies and templates.
- 6 markets – Dow Jones, S&P 500, Nasdaq, gold, crude oil and Bitcoin (CME contracts).
- Order flow events – automatic marking of icebergs, walls in the book, absorption, large trades and more (the icons in the screenshots).
- A “How to read” guide for every window – in Polish, step by step.
Frequently asked questions
What is the Hetman Terminal?
It is an order flow panel for Hetman Capital Club members: liquidity heatmap, DOM, footprint, Volume Profile, TPO, cumulative delta and time & sales on futures contracts from the CME. It runs live in your browser and, as a desktop app for Windows and Mac, on data from your own account with a data provider (the Club and its materials are in Polish).
Do I need to install software or buy exchange data separately?
To practise on the ♛ Hetman Index (IHA) you install and buy nothing – the Terminal runs in your browser. For work on real market data there is the ♛ Hetman Terminal desktop app for Windows and Mac (from the Bishop plan): you buy CME exchange data in your own name from one provider – today Interactive Brokers, soon dxFeed and Rithmic – on your own, and it flows straight to your computer. The app is for analysis only – it does not place orders – and it updates itself. Download the Terminal for Windows and Mac.
How is the Hetman Terminal different from Bookmap, ATAS or Sierra Chart?
It is the same kind of order flow tools. The difference: in the Hetman Terminal everything is ready and configured – key levels on the charts (VWAP, previous session, Initial Balance), automatically marked order flow events and a “How to read” guide (in Polish) next to every window. If you prefer to work in Sierra Chart, from the Bishop plan up you can also connect our studies in it: Sierra Chart tools.
Which markets are in the Hetman Terminal?
Dow Jones, S&P 500, Nasdaq, gold, crude oil and Bitcoin – futures contracts from the CME. The Bishop package gives you the live panel for Dow Jones, Rook all 6 markets, and Knight a session on the ♛ Hetman Index (training, simulated data) in the full panel.
Can I see the Hetman Terminal for free?
This page shows real screenshots of every window. I also practise order flow (in a reduced version) on the free stream Monday to Friday (in Polish), on the Hetman Index (a training instrument with simulated data), and you can open a free account (Pawn) in the Club without paying.
Which plan gives you which set of tools and markets – see pricing. Before you pay, you can create a free account (Pawn) in Club. Club is in Polish.
Screenshots: the Hetman Terminal on the Hetman Index (IHA), 9 Nov 2026. Frames from the Hetman Index (IHA) – a training instrument, simulated data. The names Sierra Chart, ATAS, Bookmap, NinjaTrader, Quantower, MotiveWave, Jigsaw and TradingView are used to compare the type of tools; Hetman Capital is not affiliated with them. Our studies for Sierra Chart are a separate, optional route – Sierra Chart tools. This is educational material: data and tools, not ready-made trades or investment recommendations. Trading futures involves a high risk of losing capital.