How to read charts from a real market
This series has no “how it should look” drawings. Every example is a real MYM session from my own data: Sierra Chart ticks, order book recordings, volume at the bid and at the ask. Every number in the descriptions has been checked by a script against that data.
Where the data comes from
- Trades: the December 2026 MYM contract (MYMZ26), every trade with its price, size and side (bought at the ask or sold at the bid).
- Period: regular sessions from September 15 to October 9, 2026. That's 19 full sessions, each with the previous day for comparison.
- Order book: full depth from October 8 and 9.
- Time: always Warsaw time. The regular US session is 15:30–22:00 Warsaw time, i.e. 9:30 AM–4:00 PM New York time (except in the clock-change weeks).
How to read the chart
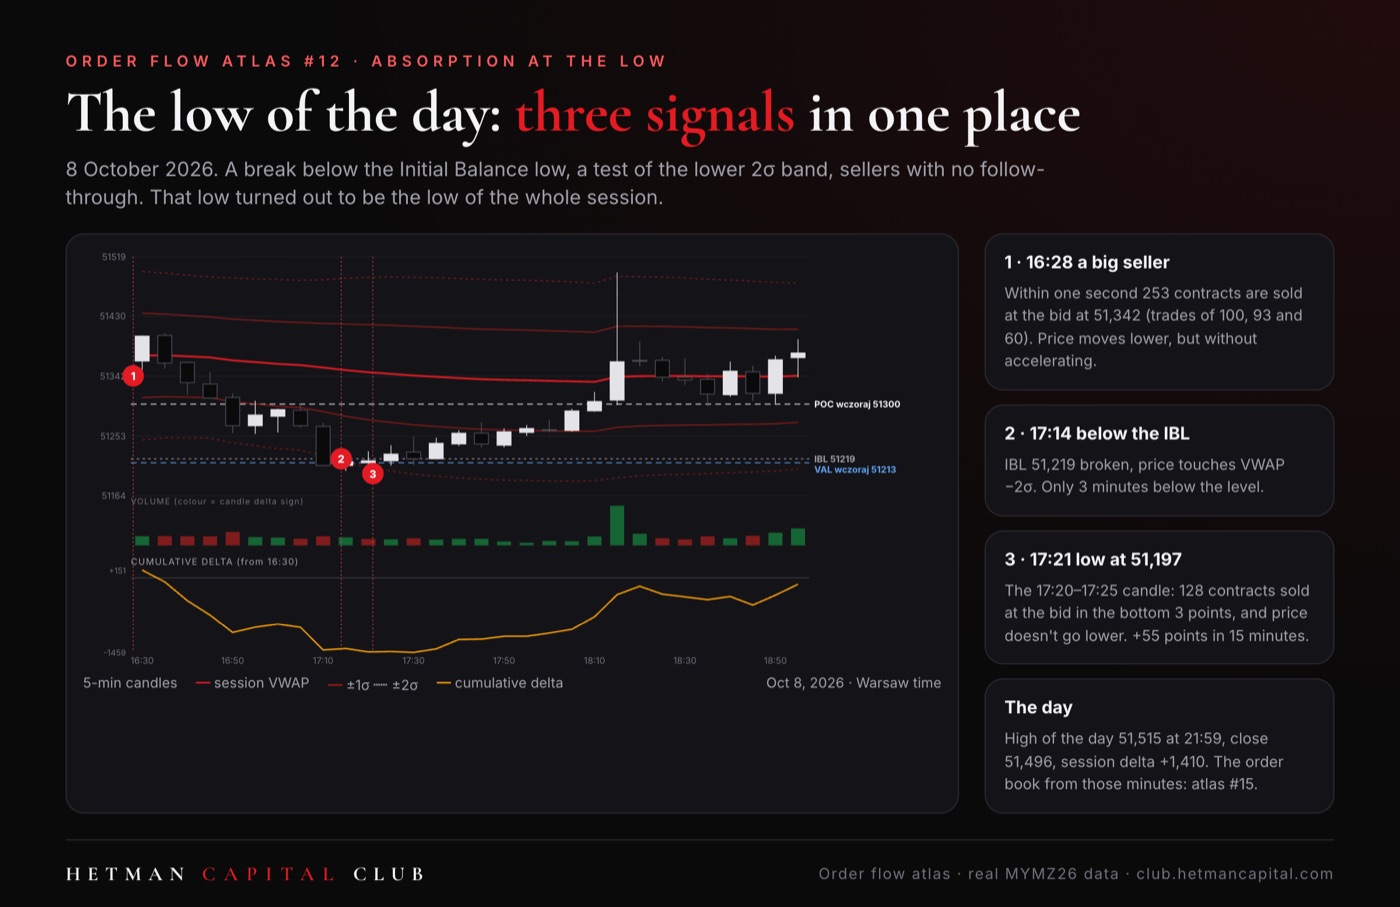
- Candles: white = up candle, dark = down candle. The candle length is given under the chart (2, 5 or 10 minutes).
- Red line: the session VWAP, i.e. the volume-weighted average price since the 9:30 AM open. The darker lines are the ±1σ bands and (dashed) the ±2σ bands.
- Horizontal lines: levels that existed at the time of the event: the previous day's value area (VAH, POC, VAL), the Initial Balance (IBH, IBL), the overnight high and low (ONH, ONL), and the previous session's high and low (PDH, PDL).
- Volume: the bars under price. A green bar = aggressive buyers dominated the candle; red = sellers.
- Cumulative delta: the orange line at the bottom. The sum of delta from the start of the chart.
- Numbered red circles: the moments described in the cards on the right and in the article text.
Series map
The open: #2 Open Drive, #3 Open Test Drive, #4 Open Rejection Reverse, #5 Open Auction.
The range and its edges: #6 a day inside the Initial Balance, #7 an accepted breakout, #8 a rejected breakout, #9 a sweep.
Behaviour at a level: #10 delta divergence, #11 absorption, #12 the low of the day, #13 a trend day and VWAP.
Participants and liquidity: #14 large trades, #15 the order book, #16 macro data minute by minute.
Putting it together: #17 one day from open to close.
Alongside the atlas there are three shorter series: MYM by the numbers (statistics from the same sessions), Order flow mistakes and Eye training (exercises: a chart cut off at the moment of decision, with the solution below).
An important caveat
I chose the examples because they show the phenomenon clearly. This is not a win-rate statistic. For every pattern I add an example where the same picture didn't work, because that's what a real market looks like. 19 sessions is a small sample, and September and early October were a period dominated by declines.
How to learn from the atlas
- Read the article and study the chart.
- Find a similar situation on your own replays (Order flow atlas #16).
- Post it to 🔍 Your chart for review with a description: context, location, behaviour.
Educational content, not investment advice. No signals, entries or position sizes.