The disposition effect
Atlas of Cognitive Biases #36 · Gains, losses and risk. You cut winners fast and hold losers long
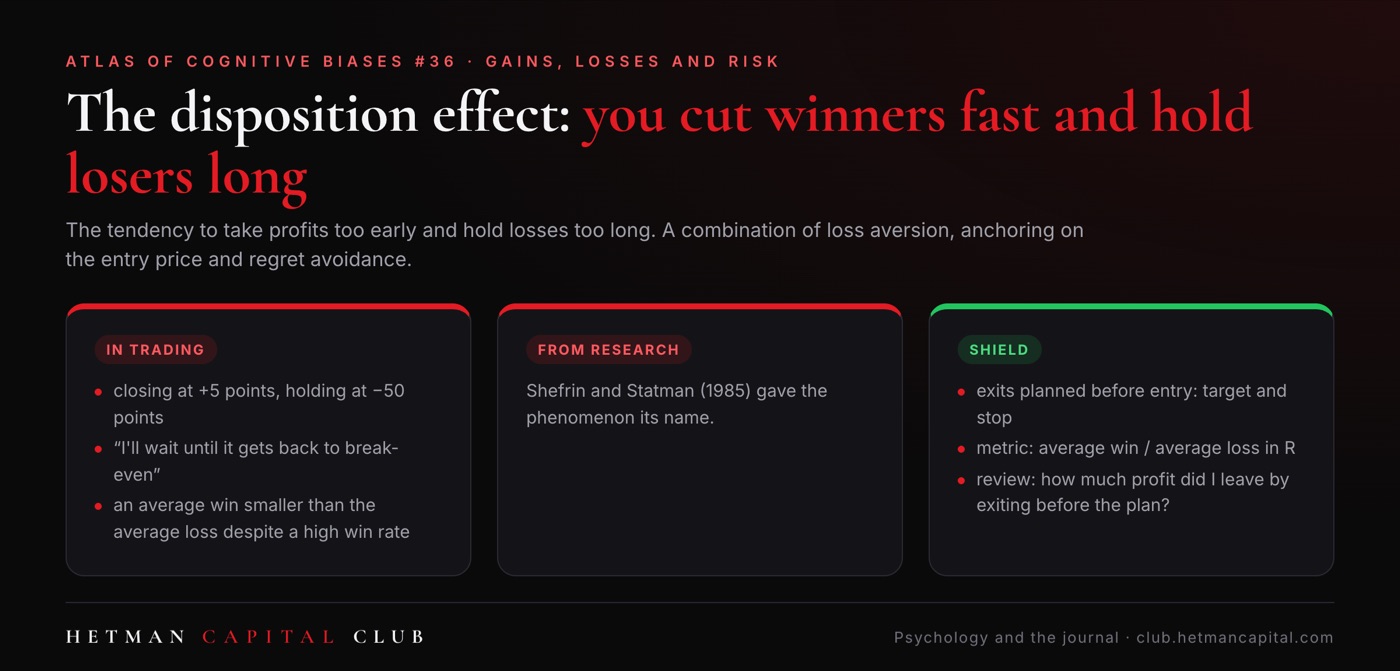
What it looks like in trading
- closing at +5 points, holding at −50 points
- “I'll wait until it gets back to break-even”
- an average win smaller than the average loss despite a high win rate
An example from a session
The journal shows a 65% win rate, yet the result is negative: an average win of 0.6R and an average loss of 1.4R. That's the classic fingerprint of the disposition effect. Metrics in Journal #4.
What the research says
Shefrin and Statman (1985) named the phenomenon. Terrance Odean (1998) analysed 10,000 accounts: investors realised about 15% of available gains but only about 10% of available losses, and the winning stocks they sold went on to outperform the losing ones they held. Locke and Mann (2005) found a similar pattern among professional futures traders on the Chicago trading floor.
The shield: how to defend yourself
- exits planned before entry: target and stop
- metric: average win / average loss in R
- review: how much profit did I leave by exiting before the plan?
Exercise
For a week, tag every situation in your journal where you notice this bias in yourself with #36, even when it didn't affect your decision. After the week, count them and write down the conditions in which it appeared most often.
Educational content, not psychological advice or an investment recommendation. You make every decision yourself, in line with your own plan.
Related biases
- Loss aversion (#34)
- Anchoring (#23)
- Regret aversion (#42)
Frequently asked questions
What is the disposition effect?
The tendency to take profits too early and hold losses too long. A combination of loss aversion, anchoring on the entry price and avoiding regret.
How does the disposition effect show up in trading?
Typical signs: closing at +5 points, holding at −50 points; “I'll wait until it gets back to break-even”; an average win smaller than the average loss despite a high win rate.
How do I defend myself against this bias?
Exits planned before entry: target and stop; metric: average win / average loss in R; review: how much profit did I leave by exiting before the plan?
Educational content, not psychological advice or an investment recommendation.